Saturday, March 5, 2022

Insane Week In 2 Charts

1. Wheat Prices Explode


Oil prices are more talked about but wheat prices exploded this week. Reaching highs that eclipse the great recession prices of Feb 2008, prices skyrocketed 50% in a single week as a result of the invasion by the largest wheat producer in the world Russia of the next highest wheat producer Ukraine. 


With so few wheat producers in the world, it is of great concern when 2 of the 5 are at war with each other. Russia and Ukraine account for roughly 30%of the world's wheat exports*

*Source: Tranding Economics

As a result of the invasion prices exploded this week and up 50% YTD


A conflict between the largest global suppliers is spreading fear that supplies will run short. Wheat prices have already been historically high due to drought conditions. Now such a dramatic increase in prices can create a supply shock resulting in food shortages amongst the poorer of wheat importers.


2. Crude Oil Prices

The conflict this week also sparked global supply crunch and tightening of prices even though sanctions have not officially hit the Russian oil industry. 

Prices this week reached 2008 recession levels.


In 3 days the price of Crude skyrocketed 23% holding prices elevated to close the week.

Gas prices followed suit this week especially in California where drivers have an abundance of taxes on top of already high prices.


US Avg gasoline prices are now at peak levels during the worst of the 2008 recession


Thursday, December 30, 2021

Travel & Leisure Recovery in Charts

Bullish
  • Travel and Leisure: $EXPE and $HLT are bullish
  • Hotels showing spending and recovery. $HLT hitting all time highs
  • $EXPE is bullish on strong hotel spending and 2022 outlook
Bearish
  • Airlines are struggling: weakening spending and new variants, Stay away
  • Restaurant brands are dismal: policy and Omicron


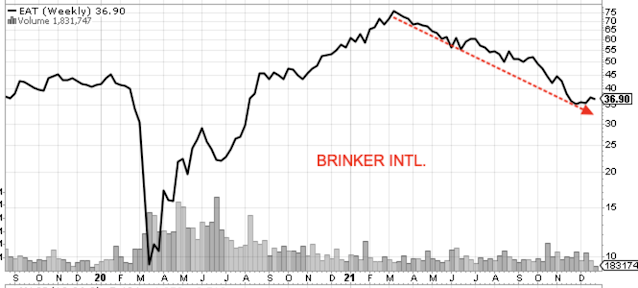
Travel and leisure stocks made a powerful recovery in 2020. Across the board travel and leisure stocks peaked in March 2021 and have largely moved sideways in 2021. $PEJ - a travel and leisure index ETF has traded just above its 2019 end of year level despite two new variants impacting travel.


Expedia $EXPE similar to $PEJ index with sideways price action since a peak in March while staying above peak 2019 levels. The stock is forming a bullish cup and handle looking prime for a breakout. News of increased travel spending could push it to breakout.

AIRLINES


Airline stocks are struggling to recover. Since the peaking in March, both Delta and Omicron variants have beaten airline stocks down creating lower lows. The index $JETS is currently trading 35% below its 2019 Dec level.


Airline spending trends to lag airline traffic volume as most people tend to purchase their tickets weeks and months ahead of their travel.

Spending shows a 40% drop during the Delta strain with a quick recovery and another 20% drop during Omicron. It is bullish that spending had less of a drop during the holiday season.

HOTELS


Hotel and lodging spending has been strong through 2021 despite occupancy dropping steadily since June.


Hilton $HLT has had a tremendous run hitting all-time highs, pricing in a strong start to 2022. The stock reflects the strong spending chart.

RESTAURANTS


Restuarant recovery has been dismal. OpenTable data shows a drop in reservations 30% below 2019 levels.


New York City was once THE place to be a restaurant owner and has never fully recovered to normal levels according to OpenTable. The data show reservations down nearly 75% from 2019 YO2Y comparisons in part by capacity restrictions, mandates and Omicron. Bottom line: NYC is a tough place to own a sit-down eatery in 2021.


Dallas by comparison recovered much stronger reaching 2019 Baseline levels in early 2021. A combination of shorter lockdown periods and less restrictions helped Texas restaurants get back to normal faster.


Brinker Intl. peaked in March along with the travel and leisure stocks but then fell 50% going into 2022. With a portfolio of restaurants all over the country, the stock price shows the dismal recovery restaurants have had in the US.


Wednesday, December 22, 2021

Ford Is Crushing It


Near term Ford has been forming a bullish, high base consolidation with a decrease in volume. Despite a rough choppy market and a failed breakout, the stock has managed to stay up in this high base. 

A break above 21.50 on significant volume could be a good entry point.


Outperforming in the EV Space
Ford stock is outperforming all major EV makers by a wide margin over the past 12 months. With EPS Q/Q at -23.8% (compared to Tesla which has EPS growth Q/Q at 430%) it come down to a technical analysis over a fundamental one to  hold the stock.

Comparing P/E

Ford: 28.54

Tesla: 327.34

Tuesday, December 21, 2021

SPX Strengths and Weakness: Breadth and Internals


Long term uptrend appears to be very much in tact.


We see a trend of sell offs on news that seem terrible at the time for markets but are only generating mid 4%-5% selloffs with relative quick recoveries. A big contrast to the 20%+ selloff at the start of the pandemic.


This market has seemed to be characterized by pandemic news taking sudden dips in September and and in November both correlated more with infection rates than fundamentals. The 50 day MA has not played a large support role. 

The market appears to have double topped but not confirmed since it did not fall below the 450 low.

Key levels on the downside:

$450 area and $430 area (200 dma)


Market Breadth 

Simply put, the number stocks participating in this market is diminishing. 92% of stocks were above their 50 day moving average in April. Since then the market has climbed higher with less participants. The number of stocks continues to fade after each new high. 

There has been a sharp drop in the past month as the market tries to form a high base.

It doesn't mean the end of the bull market but could signal structural weakness.

Friday, December 17, 2021

Analysis: SPX Off Only -2.5% After Turbulent 2 Weeks


SPX Action:

The past two weeks have been turbulent with the news of the O Variant over Thanksgiving. A 2.95% drop followed by a 3.25% drop on significant volume, then a short squeeze rally into some consolidation waiting for the FOMC announcement. 

FOMC Announcement

They say the first move is always the wrong move. Initially after the announcement the market rallied to 4725 (SPX) and immediately sold off. 4600 is holding support. A divergence in RSI is a potential sign this level could hold. 


VIX 

The VIX pushed against but did not push through 23. Vol levels remain elevated.

The net effect so far has only been a -2.56% dip from all time highs pre-variant news.

Support

SPX 4600 level remains support. Which is the 50 day moving avg. Traders will pay particular attention here.

VT

Monday, November 9, 2015

7 Trade Ideas 11/09/15

Breakout above 100, strong multi-month uptrend, breakout above avg volume, wait for pullback to enter.

In consolidation, look for a break above 21, buy pull backs to 50 day ma

resting on support of the 50 day ma, very narrow bollinger bands, look for a period of consolidation and volume squeeze

volatility expanding over past few weeks, look for a pullback to 50ma to enter

tight bollinger bands, tight consolidation range, volume tapering off, could be ready to erupt higher

resting on support

High base, tight volatility squeeze, recent 2 for 1 split

Friday, July 17, 2015

Recent Charts

Hi have not posted in a long time. I recently went through a bunch of charts. Some right some wrong. Always interesting to look at the analysis months down the road and see where I landed.